
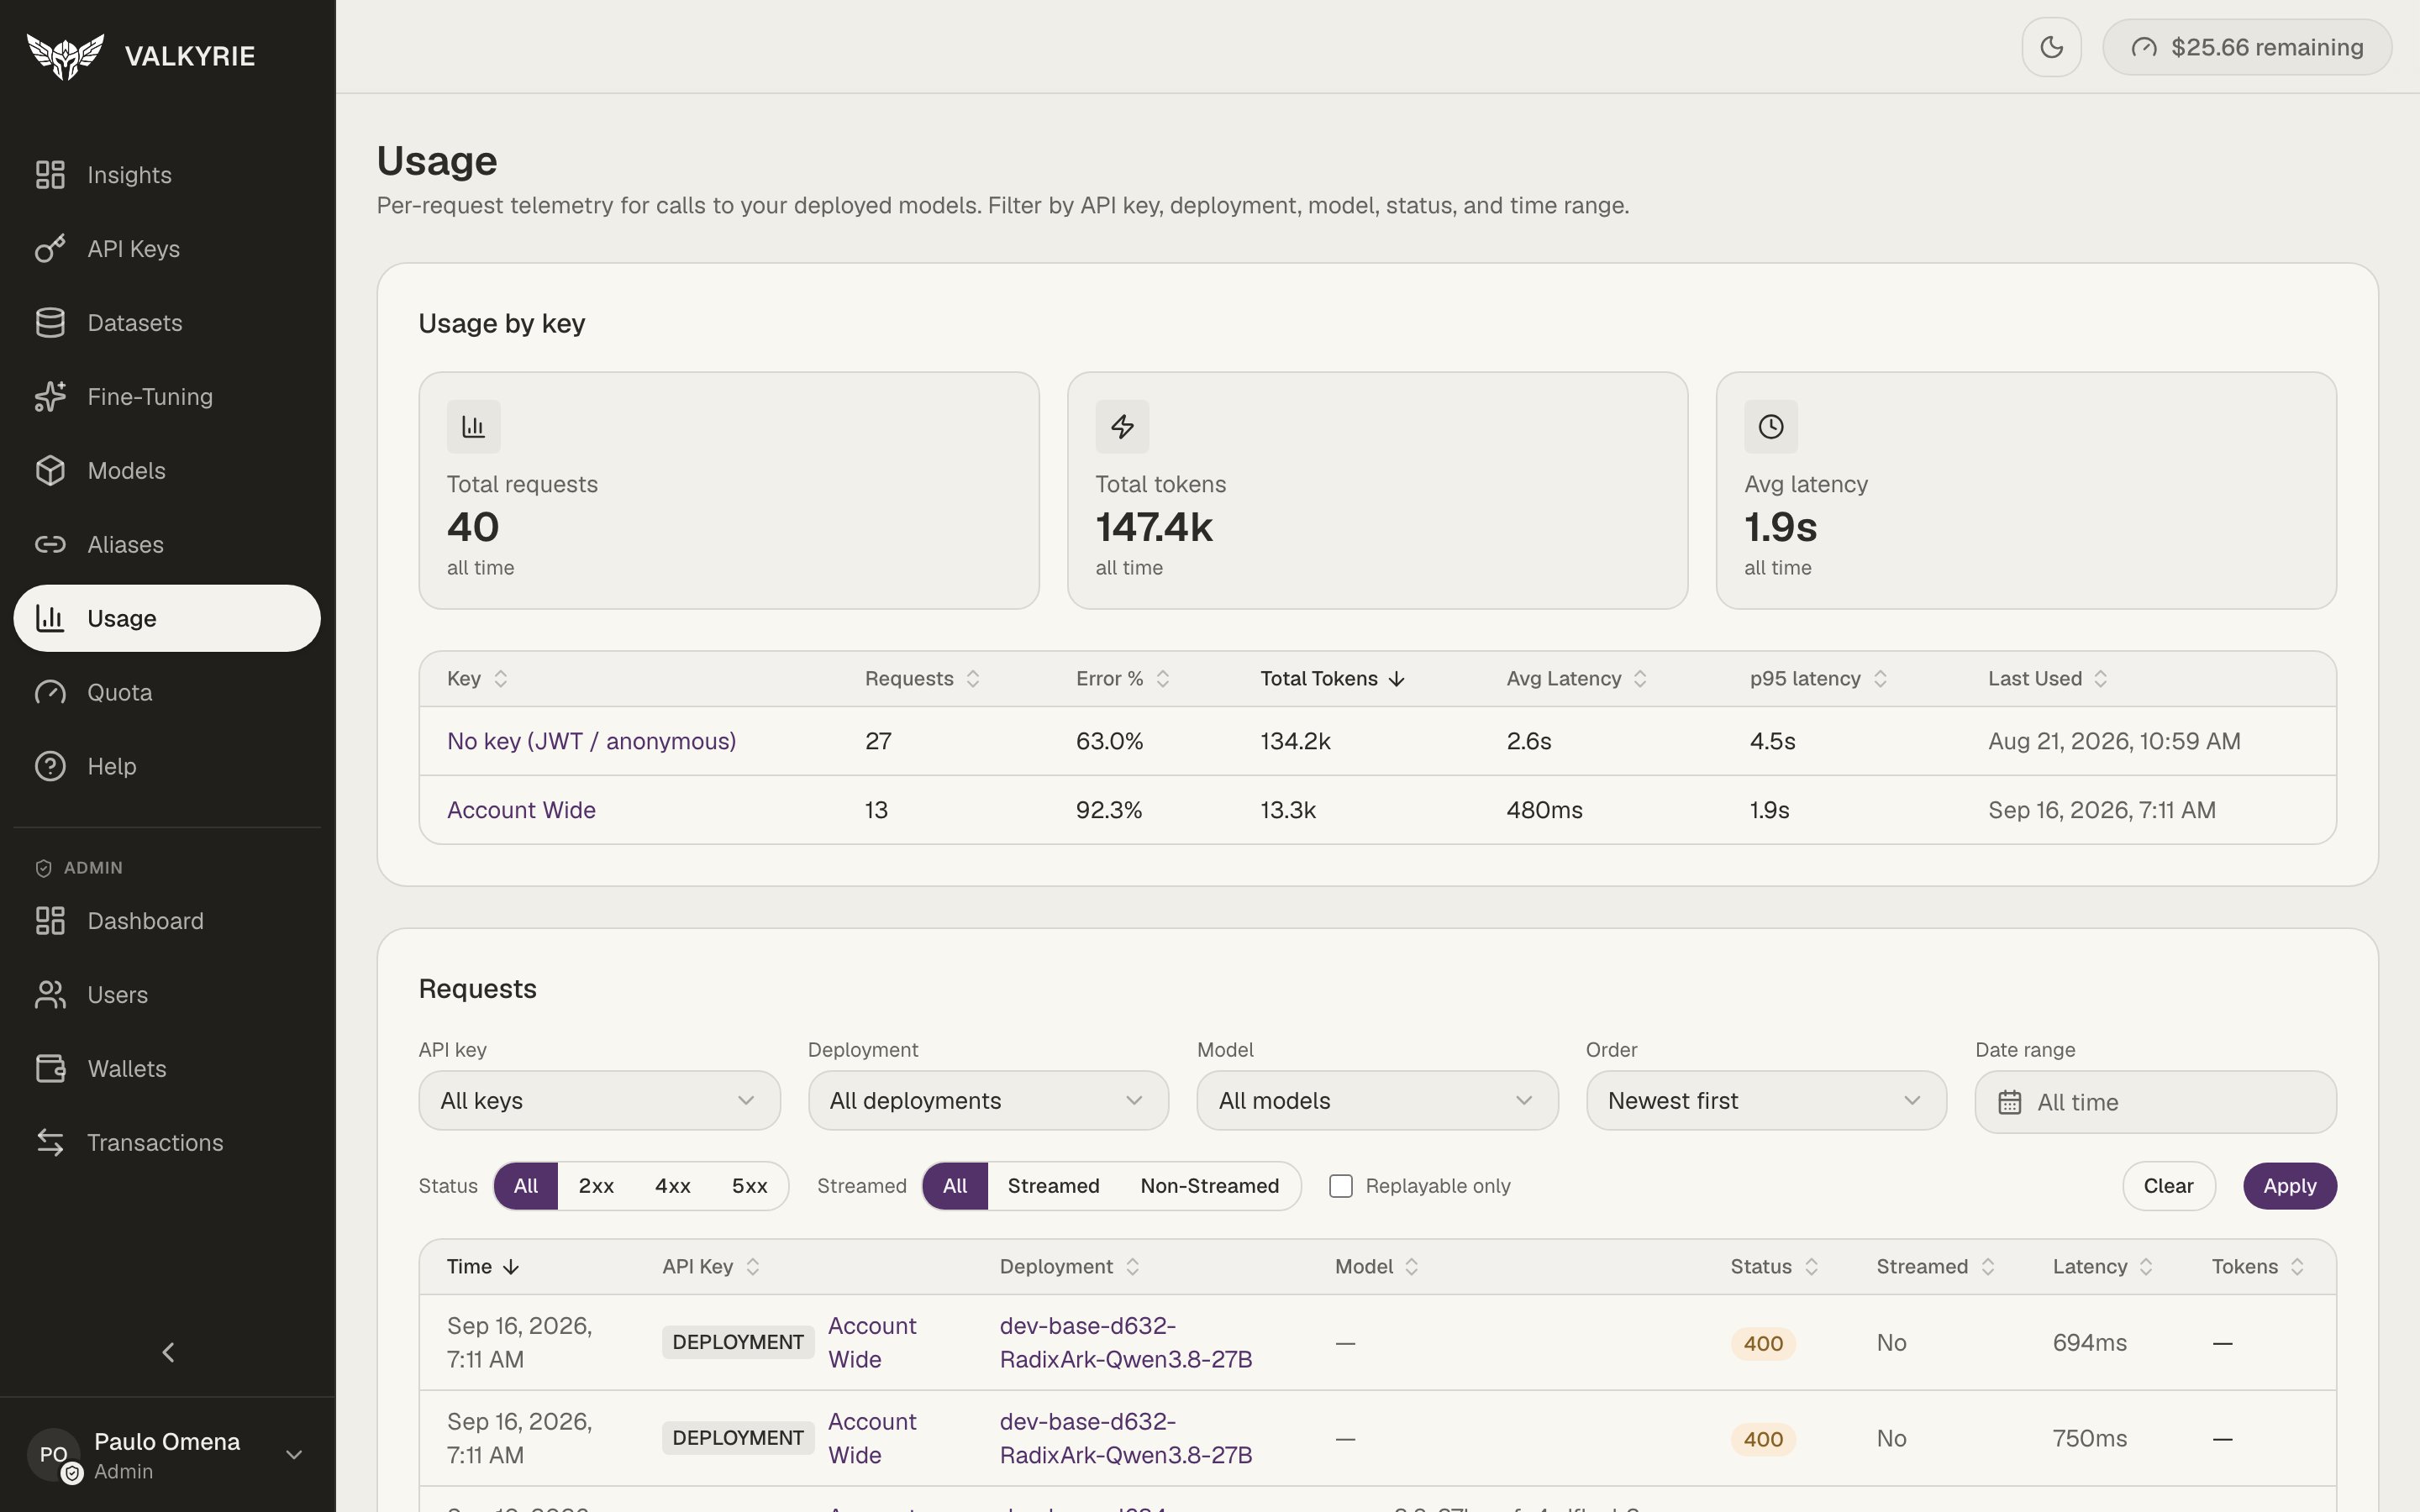
Usage: per-key rollups and a filterable request log.
Usage by key
Headline cards summarize total requests, total tokens, and average latency. Below them, a per-key table breaks down requests, error rate, total tokens, average and p95 latency, and when each key was last used. Calls made with a dashboard session (rather than an API key) are grouped as No key (JWT / anonymous).Request log
The Requests table lists individual calls with their timestamp, API key, deployment, model, HTTP status, whether the response was streamed, latency, and token count. Filter by:- API key, deployment, and model
- Status, All / 2xx / 4xx / 5xx
- Streamed, All / Streamed / Non-Streamed
- Date range, plus a Replayable only toggle